This project is a custom analytics dashboard designed to connect directly to a website’s Google Analytics account and transform raw performance data into a cleaner, more intuitive reporting experience. The goal is to simplify how site owners understand their traffic without forcing them to navigate complex GA menus or interpret overwhelming data tables.
The dashboard integrates with the Google Analytics API to securely pull key metrics such as users, sessions, bounce rate, average engagement time, traffic sources, device breakdown, geographic data, and conversion events. Instead of replicating the Google Analytics interface, the system restructures this information into a focused, visual-first layout built around clarity and decision-making.
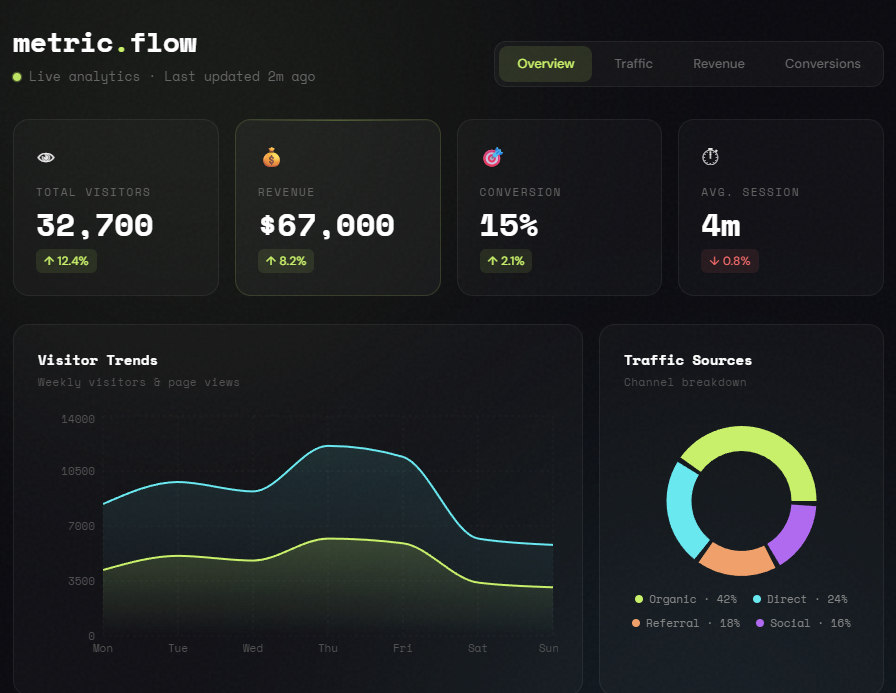
The UI prioritizes:
- Clear KPI cards for high-level performance snapshots
- Interactive charts for traffic trends over time
- Visual breakdowns of acquisition channels
- Device and location insights in simplified formats
- Conversion tracking displayed in goal-oriented views
Rather than presenting every available metric, the dashboard is structured to highlight what actually matters to business owners: growth trends, marketing effectiveness, and user behavior patterns.